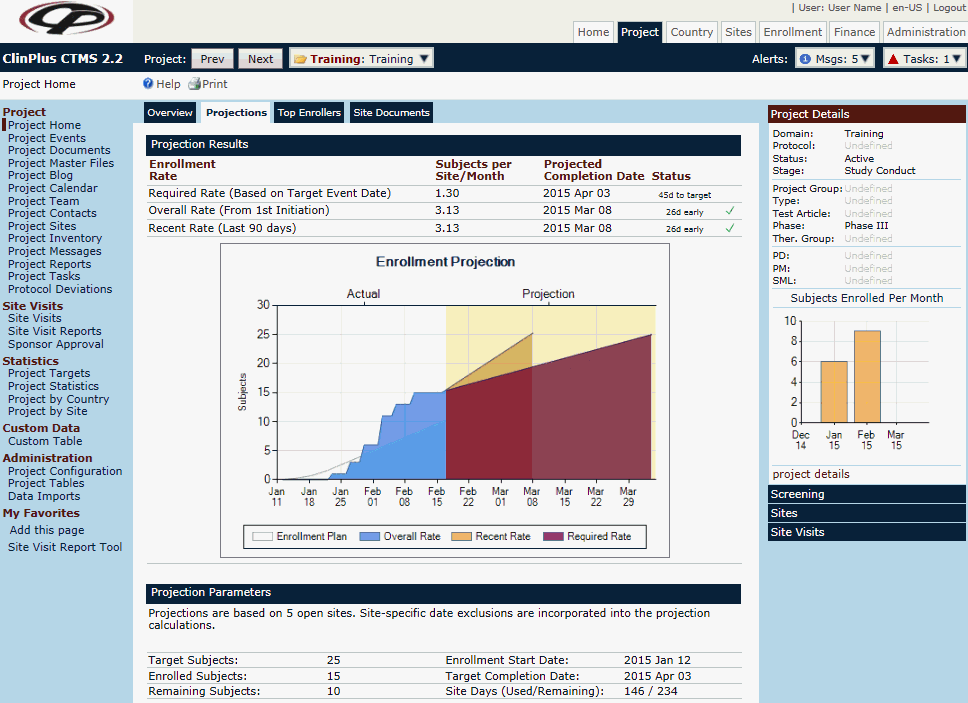
The Projections tab of the Project Home Page displays more detailed information on enrollment projection data for the current project that is viewed on the Project Overview tab. This tab will be hidden unless the user has permission for the Project Management feature. Additional tabs are available if the user has permission for the features. These include Overview, Top Enrollers, and Site Documents.
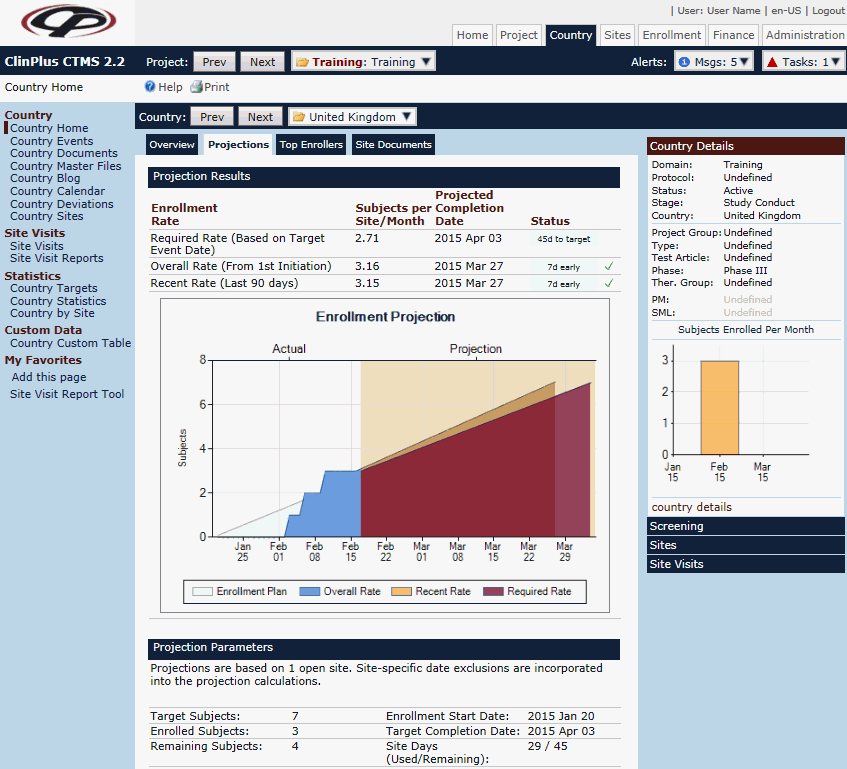
The Projections tab of the County Home Page displays more detailed information on enrollment projection data for the current project in the selected country that is viewed on the Country Overview tab. This tab will be hidden unless the user has permission for the Country Management feature. Additional tabs are available if the user has permission for the features. These include Overview, Top Enrollers, and Site Documents.
Click here for a description of the Common Buttons found throughout the system.
Project Projections Tab

Country Projections Tab

Field |
Description |
Projection Results |
This section displays the Subjects per Site/Month, the Projected Completion Date, and a Status Graphic Sprite to indicate the relationship between the Projected Completion Date and the Target Completion Date for each of three different rates. |
Required Rate |
This is the rate that is necessary to complete enrollment by the target date. The Target Completion Date which is defined as the Target Date for the Last Subject Enrolled Project Event. This line displays the rate of subject enrollment per site per month that is needed to meet the Target Completion Date. The Target Completion Date will display in the Projected Completion Date column. |
Overall Rate |
This line uses the values from the current Project Statistics. The Subjects per Site/Month column uses the value of the Enrollment Rate per Month System Variable. The Projected Completion Date column uses the value of the Enrollment Completion Date field. |
Recent Rate |
This line displays the rate of Subject Enrollment per Site per Month for a number of Recent Days.
The rate is calculated as follows:
|
Status |
The Status displays the number of days until the Target Date or the Number of Days Early or Late. |
Flag |
|
|
A Critical icon appears if the Projected Completion Date is prior to the current date, if the Target Completion Date is prior to the current date or if the Projected Completion Date is unknown. |
|
A Warning icon appears if the Projected Completion Date is after the Target Completion Date. |
|
An OK icon appears if the Projected Completion Date is on or before the Target Completion Date. |
Enrollment Projection Chart |
The time points on the X axis are:
The chart has four series of data points, using a cumulative number of Subjects on the Y axis. The four series are: Enrollment Plan
Overall Rate
Recent Rate
Required Rate
|
Projection Parameters |
|
Target Subjects |
This number is defined under the menu option Project Targets. The Target Subjects should match the Target column of the Enrolled Subjects line on the Project/Country Overview Section. |
Enrolled Subjects |
This number should match the Actual column of the Enrolled Subjects line on the Project/Country Overview Section. |
Remaining Subjects |
This number calculates the difference between the Target Subjects and the Enrolled Subjects. |
Enrollment Start Date |
Enrollment Start Date will ignore all Unknown Date values for the following steps:
|
Target Completion Date |
This number is the Target Date for the Last Subject Enrolled Project/Country Event. If no value has been entered for the Target Date, the Project Thru Date on the Project Dialog will be used. |
Site Days Used |
Site Days Used is calculated as the sum of the Site Days for all sites used in the Enrollment Rate calculations. |
Site Days Remaining |
This number will be calculated as the sum of the Site Days left between the current date and the Target Completion Date. If the Target Completion Date is prior to the current date, this field will be set to zero. |